A project status report template is a fixed layout for telling sponsors and stakeholders where a project or program stands: an overall color, a short summary, health by area, milestones, risks and the decisions you need. The one below is built for programs, so it also has a monthly roll-up across workstreams.
Copy it into a spreadsheet or download it as an Excel or Word file. It's filled in for a fictional billing system migration, so you'll see what a good update looks like before you write your own. It's free, with no sign-up. If you want the wider set of program documents, our program management templates page links the rest.
- Use the weekly tabs for your team and sponsor, and the monthly roll-up for a steering committee.
- Rate schedule, budget, scope, risks, resources and quality separately, then set the overall color. Overall isn't greener than the area that explains it.
- Write the summary last, in two to four sentences, and lead with the color and the reason for it.
- Put every decision you need in the report with an owner and a date, and a red shouldn't ever be a surprise.
Free project status report template: copy it or download it as Excel or Word
The template has five tabs. Tab 1 is the weekly report, with the summary and the plan for next period. Tab 2 rates six areas. Tab 3 tracks milestones against the baseline. Tab 4 logs risks, issues and decisions. Tab 5 is the monthly roll-up, one row per workstream. Everything in it is an example, so you'll replace the program, dates and numbers with your own. Don't keep the tabs you won't use.
Project status report template for a program
Five tabs: the weekly report header and summary, health by area, milestones, risks, issues and decisions, and a monthly roll-up across workstreams. Everything is filled in for a fictional billing system migration. Replace the example values with your own and delete the tabs you don't use.
- Program
- Billing system migrationName of the program or project
- Reporting period
- Week of Nov 2, 2026The dates this report covers
- Prepared by
- Program manager
- Sponsor
- VP Finance
- Overall status
- AmberGreen, Amber or Red, never worse or better than the area ratings explain
- Summary
- Amber because UAT starts one week late. Vendor delivery of the test environment slipped nine days. The go-live date still holds if UAT runs two weeks instead of three, which needs the sponsor's decision by Nov 6.Two to four sentences. Lead with the status and the reason for it.
- Done this period
- Cutover plan drafted to 80%; data mapping signed off; two of five integration tests passed
- Planned next period
- Finish the cutover plan; run the remaining three integration tests; confirm UAT dates
| Area | Status | Trend | Comment |
|---|---|---|---|
| Schedule | Amber | Worse | UAT start forecast Nov 16, baseline Nov 9; go-live date holds only if UAT is cut to two weeks |
| Budget | Green | Same | Forecast $1.84M against a $1.9M budget; no change this week |
| Scope | Green | Same | No open change requests |
| Risks | Amber | Worse | Two high risks open, both with a mitigation and an owner |
| Resources | Green | Same | All roles filled; the data lead is out Nov 20 to 24 and a backup is named |
| Quality | Green | Better | Two of five integration tests passed, no open severity 1 defects |
| Milestone | Owner | Baseline date | Forecast date | Status | Note |
|---|---|---|---|---|---|
| Data mapping signed off | Data lead | Oct 23 | Oct 23 | Done | Signed off by finance |
| Integration tests complete | QA lead | Nov 6 | Nov 9 | Amber | Test environment arrived late |
| UAT start | Workstream lead | Nov 9 | Nov 16 | Amber | Depends on the test environment |
| Cutover plan approved | Program manager | Nov 20 | Nov 20 | Green | Draft is 80% done |
| Go-live | Sponsor | Dec 7 | Dec 7 | Amber | Holds only with a two-week UAT |
| ID | Type | Description | Owner | Due | Status |
|---|---|---|---|---|---|
| R1 | Risk | Vendor delivers the production build late and compresses cutover rehearsal | Program manager | Nov 13 | Open, mitigation agreed |
| R2 | Risk | Key data lead is out Nov 20 to 24, during cutover rehearsal | Workstream lead | Nov 12 | Open, backup named |
| I1 | Issue | Test environment arrived nine days late | Vendor manager | Nov 6 | Resolved Nov 5 |
| D1 | Decision | Cut UAT from three weeks to two to protect the Dec 7 go-live | Sponsor | Nov 6 | Needed from sponsor |
| Workstream | Lead | Status last month | Status now | Biggest risk | Decision needed |
|---|---|---|---|---|---|
| Data migration | Data lead | Green | Green | Backup for the Nov 20 absence | None |
| Integrations | QA lead | Green | Amber | Test environment delay | Approve a shorter UAT |
| Finance and billing rules | Finance partner | Amber | Green | Tax rule sign-off now done | None |
| Training and cutover | Workstream lead | Green | Green | Rehearsal window is tight | Confirm rehearsal dates |
How to read the example: the program is amber overall because one thing slipped, and the report says exactly which thing, by how much and what protects the end date. There's no vague language in it. The area ratings explain the color. Schedule is amber, risks are amber, and the rest is green, so a sponsor can see in ten seconds that the problem's narrow. The decision in Tab 4 is the reason the report exists, and it names who must decide and by when.
That structure is the point. A status report that only says "amber" gets a nod, but one that says amber, why, what holds the date and who has to decide gets an answer.
What should a project status report include?
A project status report should include the project and period, an overall status, a short summary, health by area, milestones, risks and issues, and the decisions you need. Most published templates agree on that core, though they differ on the extras, and that's where yours can be better. ProjectManager's template adds a change log and a quality section, and Bricks recommends rating each area separately instead of giving one color for everything.
Here's what each section does in the template above and why it earns its place.
| Section | What goes in it | Why it's there |
|---|---|---|
| Header | Program, reporting period, author, sponsor | Readers can tell which report and which week they're looking at |
| Overall status | One color: green, amber or red | The answer a busy sponsor reads first |
| Summary | Two to four sentences: the color, the reason, what protects the date | The only part some people will read |
| Health by area | Schedule, budget, scope, risks, resources, quality, each with a color and a trend | Shows where the pressure is instead of hiding it in one color |
| Milestones | Baseline date, forecast date and status per milestone | Makes slippage visible against the plan |
| Risks, issues and decisions | The top items with an owner and a due date | Turns the report into actions |
| Monthly roll-up | One row per workstream, last month and now | Lets a steering committee compare workstreams without reading five reports |
Keep the risk list short; it's easy to let it grow. ProjectManager's guidance is to focus on the five most important risks and issues, and a long list buries the one that matters, which is rarely the first one on it. The detail doesn't belong in the report. It belongs in your RAID log or risk register, with the report linking to it.
How do you fill in a project status report?
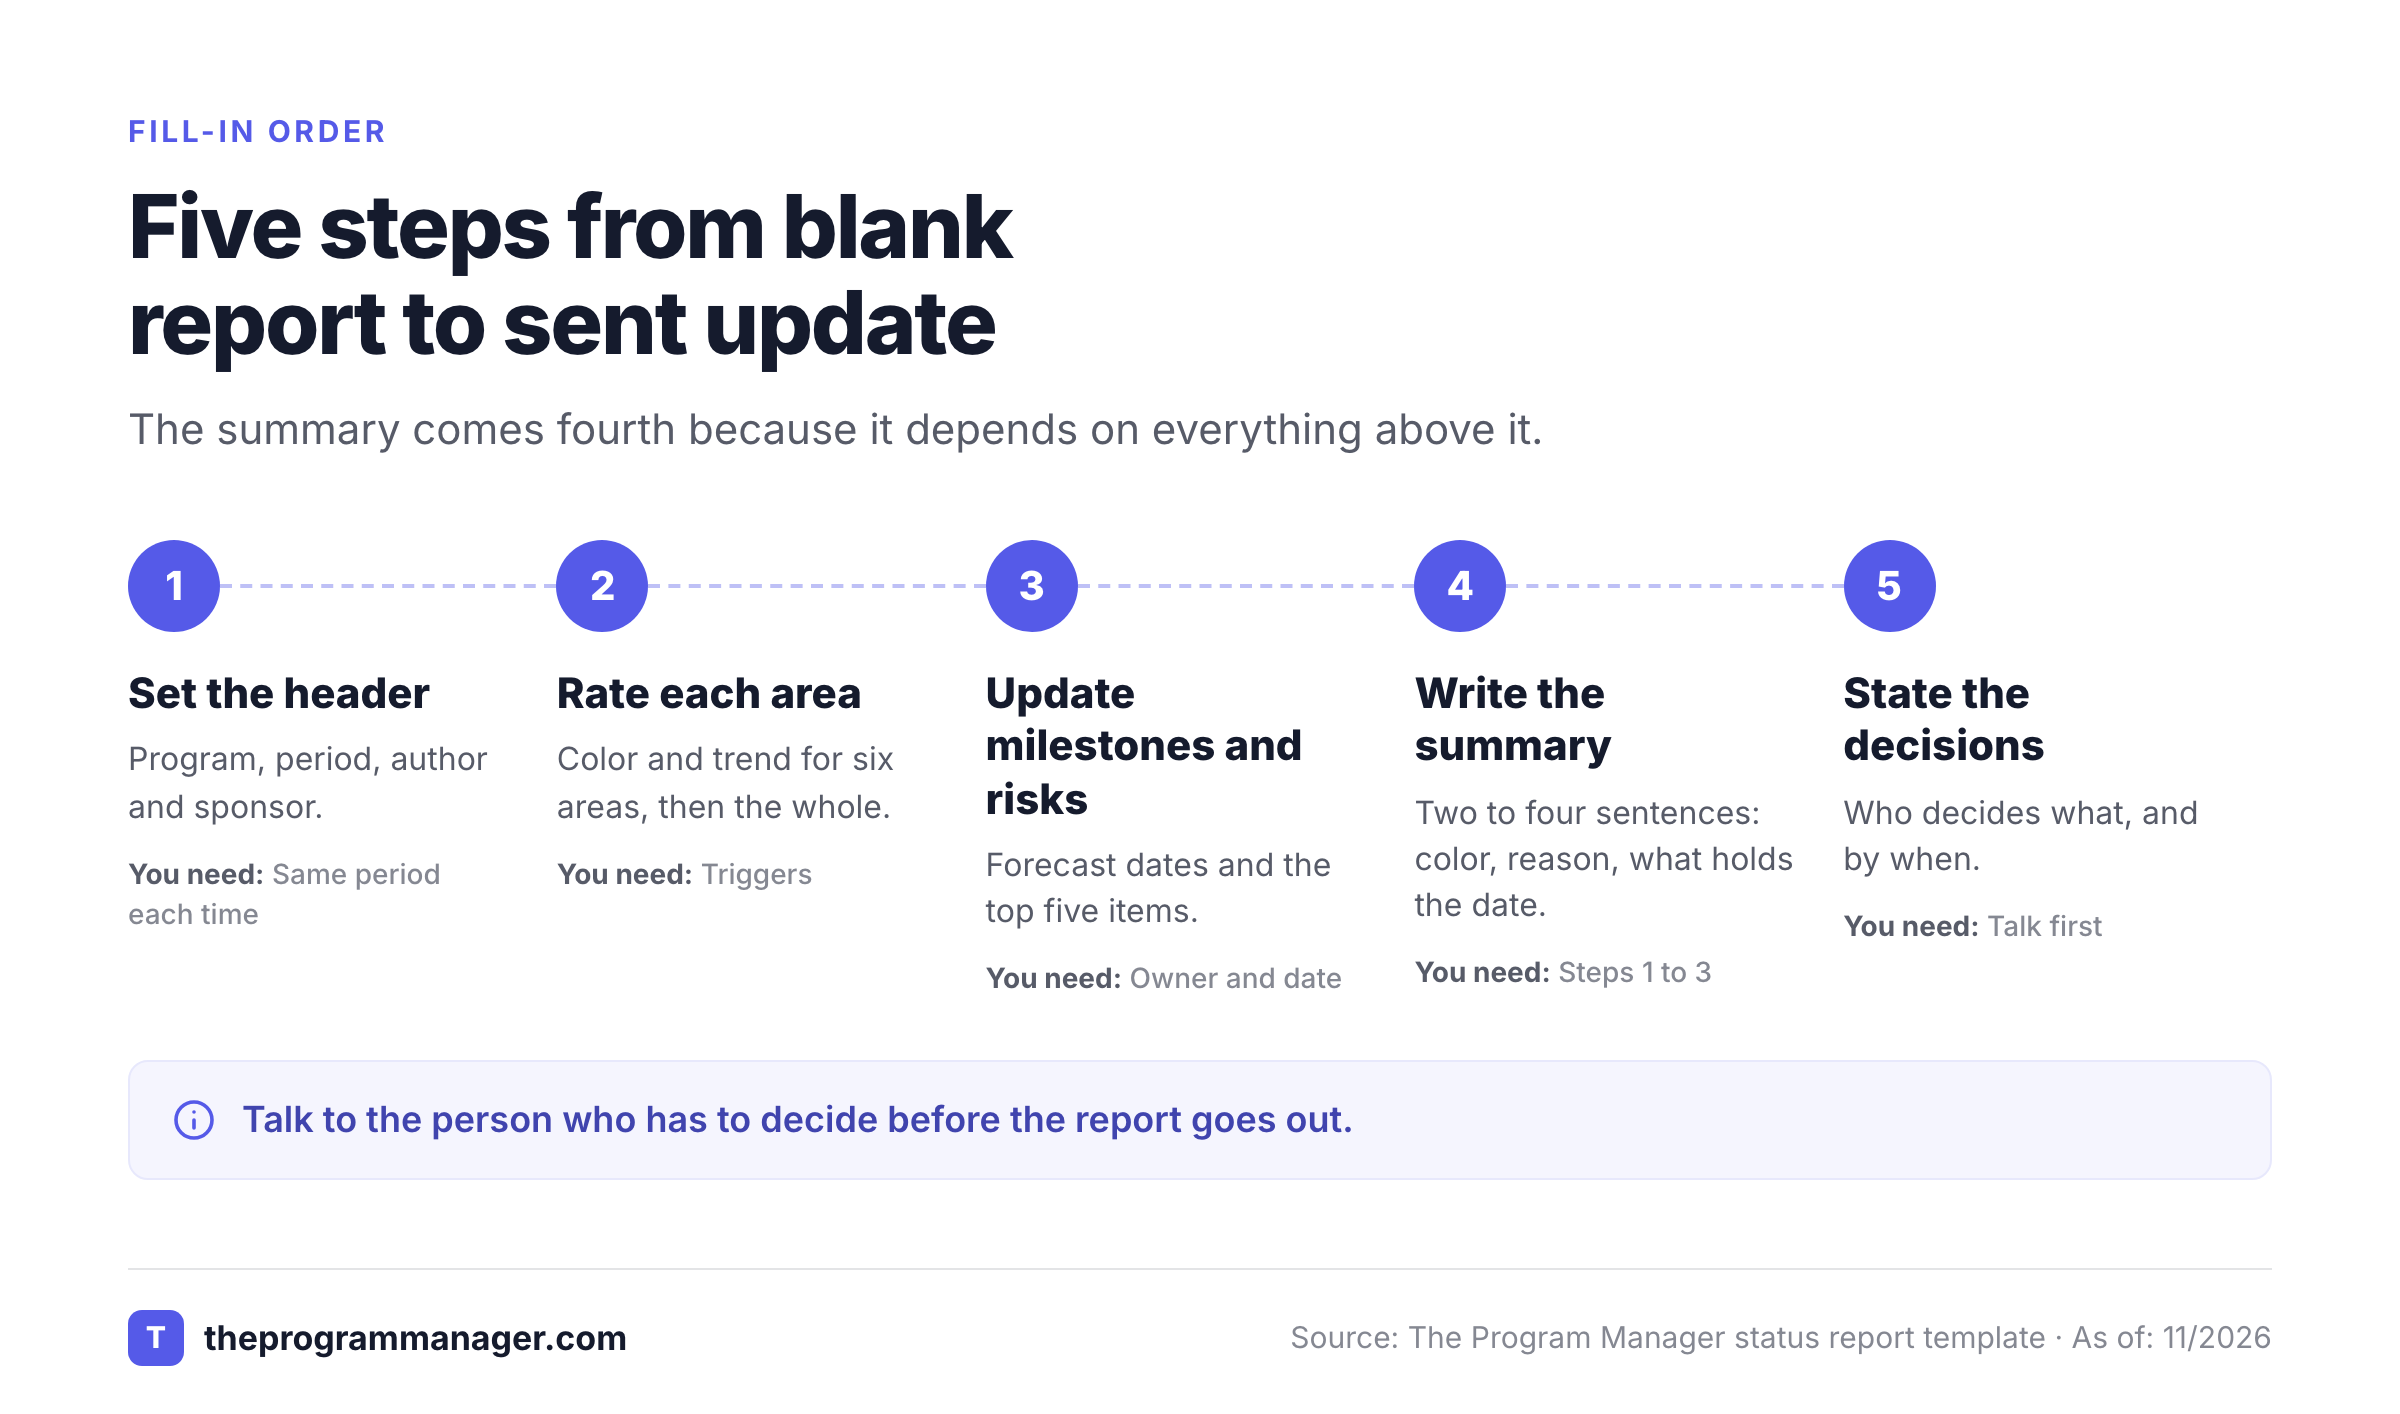
Fill in a project status report by setting the header, rating each area, writing the milestones and risks, writing the summary last and listing the decisions you need. The five steps below take about fifteen minutes once the template's set up, and the order matters because the summary depends on everything else.
Set the header and the period
Fill in the program, the dates the report covers, who wrote it and who it's for. Use the same period every time, so readers can compare this week with last week's.
Rate each area, then the whole
Give schedule, budget, scope, risks, resources and quality a color and a trend using the triggers in the next section. Set the overall color last. It shouldn't look better than the worst area unless you've explained why.
Update milestones and the top risks
Move the forecast dates, mark what's done and list the five risks and issues that matter most. Give each an owner and a due date.
Write the summary last
Two to four sentences. Say the color, give the reason and say what protects the end date. If the first sentence could apply to any program, it's not specific enough, so rewrite it.
State the decisions you need and send
List each decision with the person who must make it and the date. Then talk to that person before the report goes out, because they shouldn't learn about it from a spreadsheet. ProjectManager's advice is never to surprise stakeholders with bad news in the report itself.
- The overall color matches the area ratings
- The summary leads with the color and the reason
- Every milestone has a baseline and a forecast date
- Each risk, issue and decision has an owner and a date
- Anyone named in a red has already heard about it
- The period and the program name are correct
What do red, amber and green mean in a status report?
Green means on track, amber means off plan but recoverable within the team's own authority, and red means the end date or budget is at risk or the fix needs a decision, money or people the team can't get alone. Definitions differ between organizations, so use your PMO's if it has them. They don't need to match ours. One widely read project management guide, Rebel's Guide to Project Management, defines red as needing management attention beyond what the project manager can provide, and recommends reporting red if you can't justify amber.
Colors drift unless each one has a trigger, and they drift toward green. The table gives one set of starting points per area. They're our defaults for a mid-size program, not an industry standard, so you'll want to adjust the numbers to your tolerances and footnote them on the report. The same guide gives other examples of PMO thresholds, such as a forecast overspend above 15%, and that's why you shouldn't copy a number you haven't checked.
| Area | Green | Amber | Red |
|---|---|---|---|
| Schedule | Forecast dates match the baseline | A milestone is forecast late, but the end date holds | End date forecast more than 2 weeks late |
| Budget | Forecast within the budget | Forecast up to 5% over, with a plan to recover | Forecast more than 5% over, or unfunded changes |
| Scope | No open changes | Change requests pending, none approved | Approved or unapproved scope growth with no matching date or budget change |
| Risks | No high risks without a mitigation | High risks open, each with a mitigation and an owner | A high risk with no mitigation, or one that has happened |
| Resources | Roles filled | A gap under 2 weeks, with cover | A gap over 2 weeks, or no cover for a critical role |
| Quality | No open severity 1 defects | Defects open, with a fix date | Severity 1 defects with no fix date |
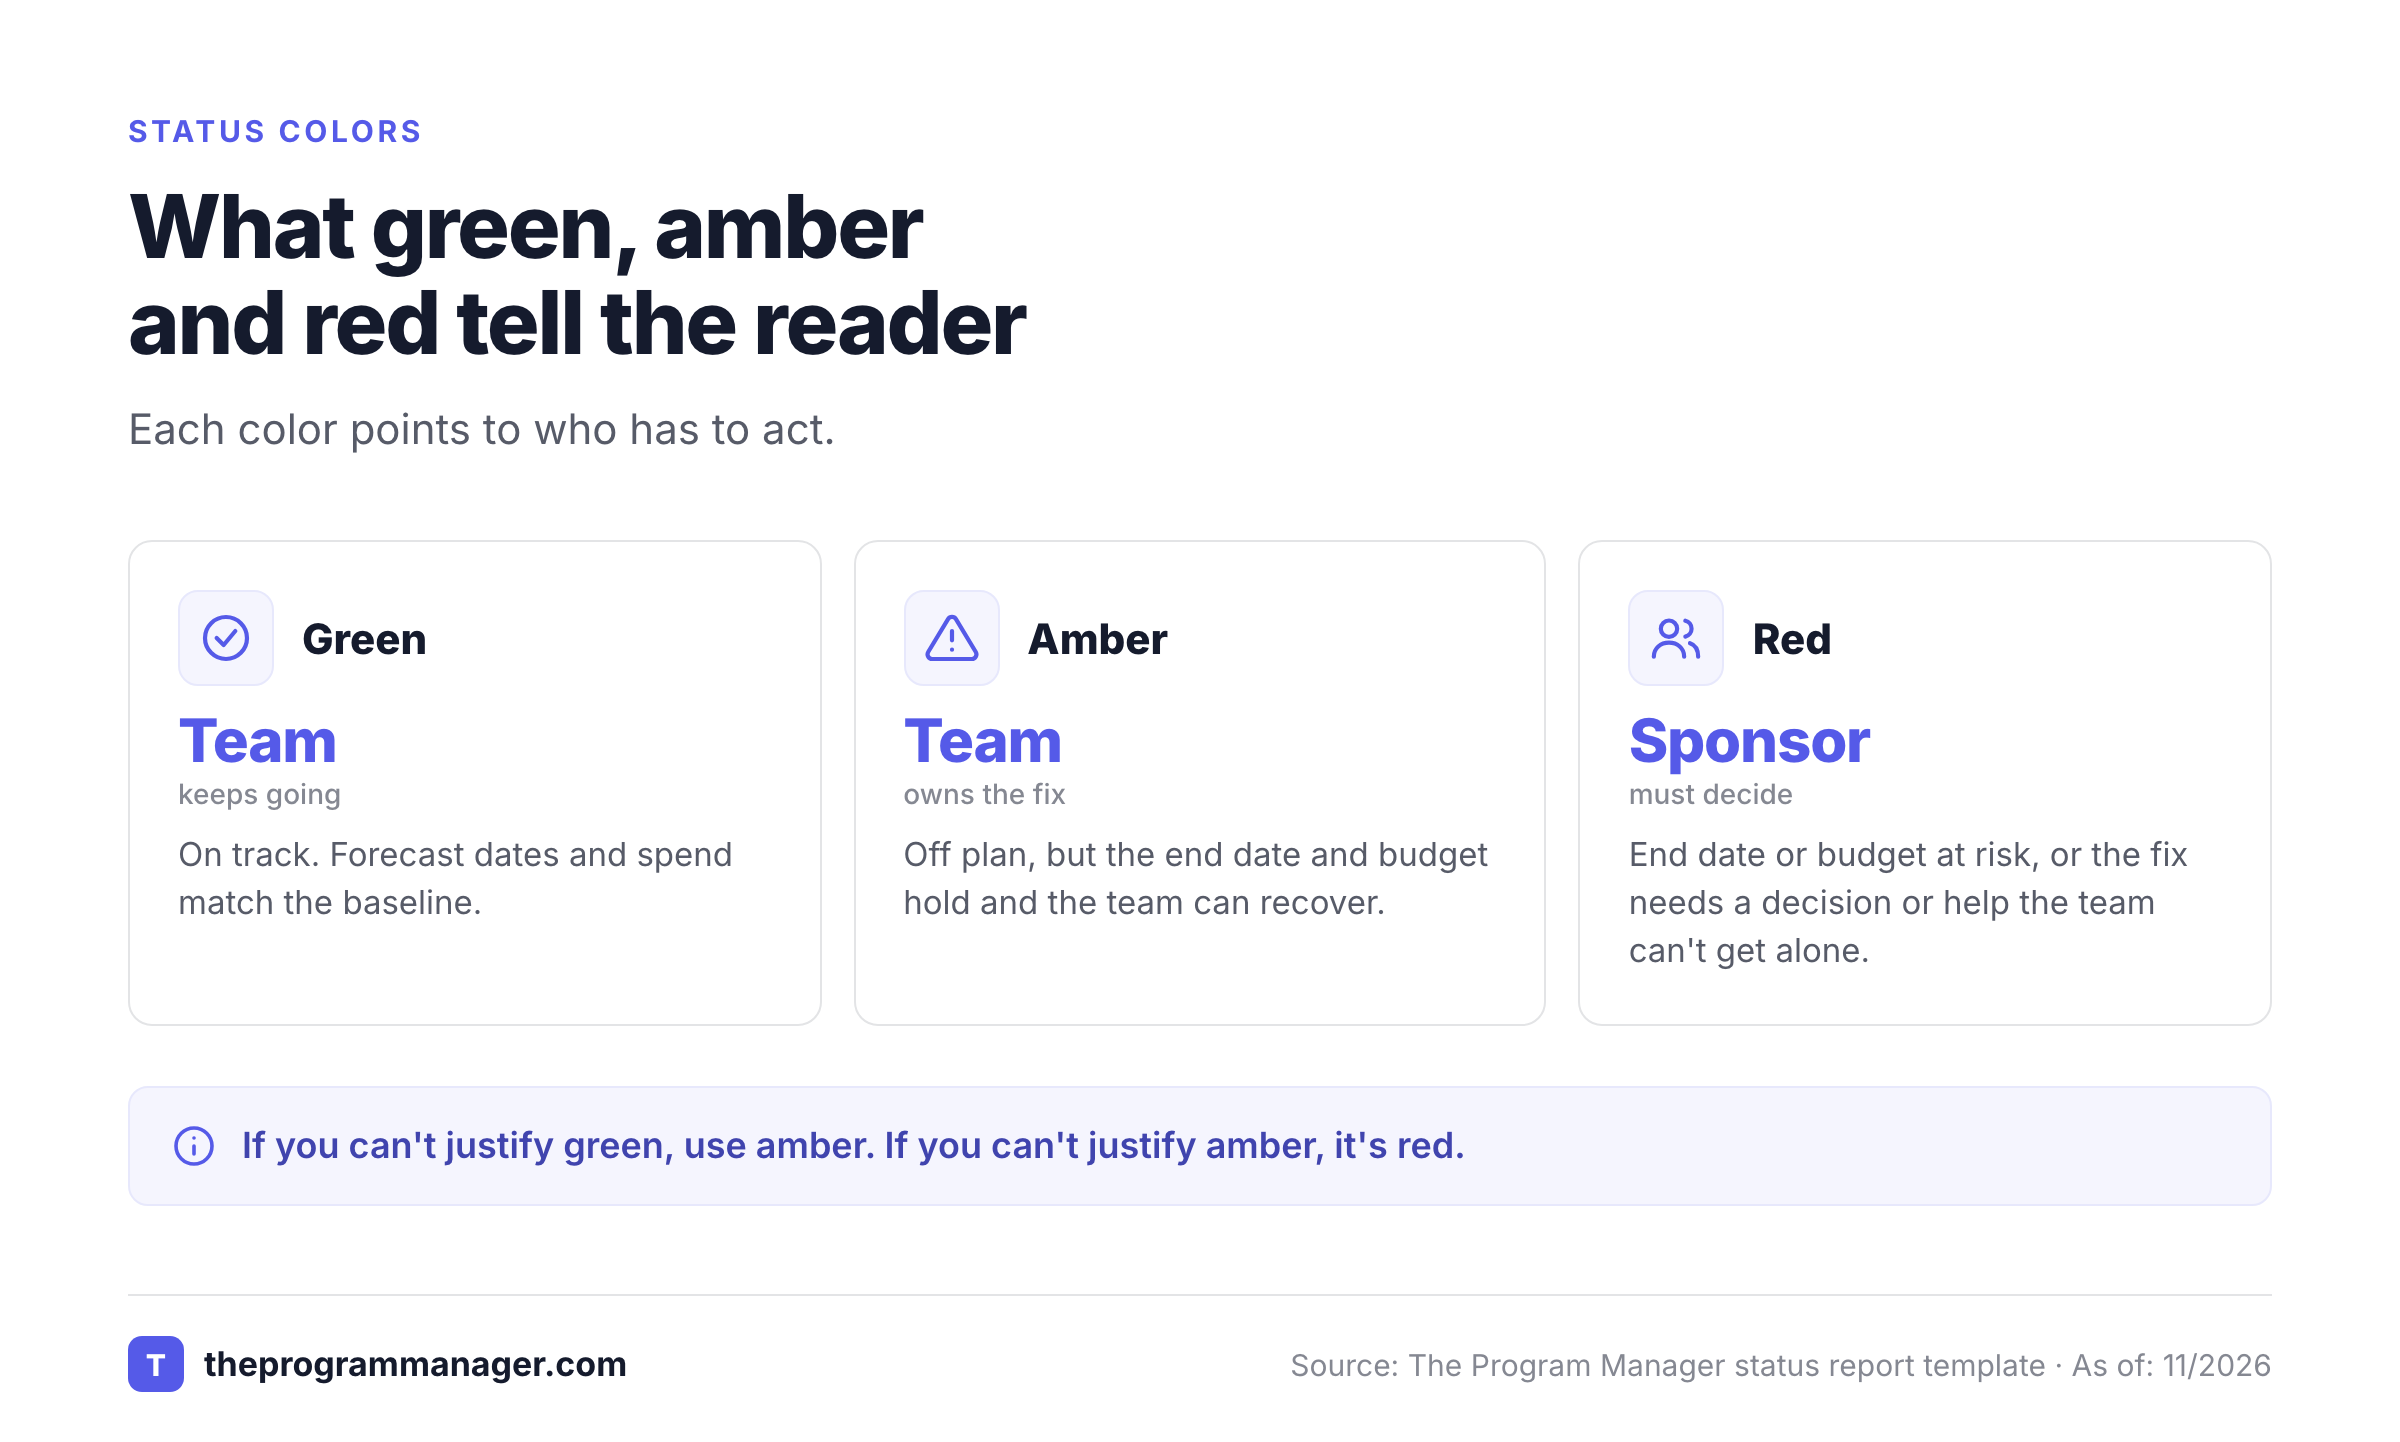
Two habits keep the colors honest. Report an area as green only if you can defend it with a number, and rate areas separately, so one bad week in testing doesn't turn a healthy budget amber. The Bricks guide makes the same case for rating each dimension on its own.
How often should you send a project status report?
Send a weekly report to the team and sponsor while the work is active, and a monthly report to a steering committee. A slower project can move to every two weeks. The right cadence isn't fixed. It follows how fast the status changes rather than the calendar, and it depends on what the reader can act on.
| Report | Audience | How often | What it contains |
|---|---|---|---|
| Weekly status report | Team, sponsor, workstream leads | Weekly while work is active | Tabs 1 to 4: summary, areas, milestones, risks and decisions |
| Biweekly update | Sponsor on a slower project | Every two weeks | The same, with a longer look back |
| Monthly program roll-up | Steering committee, executives | Monthly | Tab 5 plus the decisions only the committee can make |
| Escalation note | The person who can fix a red | When something turns red | Two lines: what changed and what you need |
ProjectManager suggests matching the cadence to the project's activity, with weekly reports for active work. Another guide, from PPM Express, says weekly updates suit fast-moving projects and biweekly or monthly updates suit long-term initiatives. For a program, the useful split is the one in the table, and it's the one we'd start with. Weekly reports go to the people who can unblock the work, but the monthly roll-up goes to the people who govern it.
Who should receive it? Send the weekly report to the sponsor, the workstream leads and anyone who owns a decision in it, and send the monthly roll-up to the steering committee. A wider list than that dilutes it, because people stop reading what doesn't concern them. A red shouldn't wait for the next report, though. Send the escalation note the day it turns red, then show it in the next report as already known. Nobody should learn about a red from the report.
What does a good status update sound like?
A good status update names a number, an owner and a date, and it doesn't hedge. Vague updates ("good progress", "waiting on finance") force the reader to ask follow-up questions, and the report exists to save that conversation, and it can't if it starts one. The table rewrites four common weak updates.
| Weak update | Better update | What changed |
|---|---|---|
| Good progress on cutover. | Cutover plan is 80% drafted; two open items, both owned by the workstream lead, due Friday. | A number, an owner and a date |
| Waiting on finance. | Budget approval for the extra test environment has been with finance since Oct 26; a decision by Nov 6 keeps UAT on schedule. | The delay, the date and the consequence |
| Some risk on the schedule. | Vendor delivery is forecast nine days late; the go-live date holds only if UAT shrinks from three weeks to two. | The size of the risk and what protects the date |
| Green. | Green: forecast spend matches the baseline and no open risk needs sponsor help. | The reason for the color |
How long should a project status report be? A weekly report should fit on one page, and a monthly program roll-up should stay within two or three. Keep it short, but don't squeeze the decisions off it. Bricks recommends a one-page target with links to the detail, and a report people actually finish beats a thorough one they skim. That isn't a reason to hide detail, just to link to it. Cut sections nobody reads after a few cycles; they're only noise.
Which project status report format should you use?
Use Excel for a weekly report you'll update and reuse, Word when the report goes into a document or an email, Google Sheets when several people edit it and PowerPoint when you present it. The download above covers Excel and Word. Sheets and PowerPoint each take one extra step, and you don't need all four.
| Format | Best when | How to get it from this page |
|---|---|---|
| Excel (.xlsx) | You update the report weekly and want dropdowns and colors | Download the Excel file |
| Word (.docx) | The report is a document or an email attachment | Download the Word file |
| Google Sheets | Several leads fill in their own rows | In Sheets, choose File, then Import, and upload the Excel file |
| PowerPoint | You present the monthly roll-up | Copy the Tab 5 table from the Excel file onto a slide |
| A short weekly note | Paste the Tab 1 summary and the decisions into the body |
If you only need one tab in Sheets, use Copy as text on the template card and paste it straight in. The Excel file's got dropdowns on the status columns and colors the cells green, amber and red, so the report reads at a glance.
What does a status report not tell you?
A status report tells people where the program stands, but it doesn't say why a date moved, which dependency caused it or what else will move next. Pair it with a program roadmap template or, for a single project, the project roadmap template for dates, a project dependency matrix template for handoffs, a RACI template for who owns each decision and the program management plan template for the baseline the report measures against.
A status report also isn't a dashboard. A dashboard shows live numbers anyone can open, but a report adds the judgment: the color, the reason and the decision you need. The two work together, and neither replaces the other.
The other weakness is that the report is only as current as the person who wrote it, and that's usually a Thursday afternoon. If your teams work in Jira and Asana, the milestone and risk rows are often copied by hand from tools that already know the answer. The Program Manager maps dependencies across Jira and Asana and watches milestones for risk, so you can check those rows against the tools before the meeting, not during it, and you won't be copying them by hand.
Project status report template FAQs
These answers cover what people ask when they're setting up a status report for the first time.
Is there a free project status report template I can download?
Yes. There's a free project status report template on this page, and it downloads as an Excel or Word file with no sign-up. It's got a weekly report, health by area, milestones, a risk and decision log and a monthly roll-up.
What should a project status report include?
A project status report should include the project and reporting period, an overall status, a short summary, health by area, milestones, risks and issues, and the decisions you need. Add a monthly roll-up if you're reporting across several workstreams.
How do you write a project status report?
Set the header, rate each area, update the milestones and top risks, write the summary last and list the decisions you need. Lead the summary with the color and the reason for it, and don't skip the owner and date on every risk and decision.
How often should you send a status report?
Weekly while the work is active, and monthly for a steering committee. Slower projects can move to every two weeks. Send a short escalation note the day something turns red. Don't wait for the next report.
What do red, amber and green mean?
Green means on track, amber means off plan but recoverable by the team, and red means the end date or budget is at risk or the fix needs help the team can't get alone. Your PMO's definitions come first, and the triggers in this template are example defaults.
Can I use this project status report template in Google Sheets?
Yes. In Google Sheets choose File, then Import, and upload the Excel file. You can also use Copy as text on the template card and paste a tab straight into a sheet.
Leave a Reply